GreenCo 近期為一家在亞洲擁有廣泛業務網絡的知名連鎖餐廳集團完成了年度 ESG 報告。 鑑於該集團在跨國境範圍內擁有大量餐廳、辦公室及中央廚房,我們以系統化且結構化的方式,有條不紊地處理並分析其 ESG 數據,最終產出分類明確的分析結果,使各地理區域(從餐廳層級到業務單位層級)之間得以進行具實質意義的比較。

與此同時,我們了解到,隨著各界對企業脫碳的關注與興趣日益增加,各家公司都對自身的碳排放狀況感到好奇。因此,為了更清楚地說明碳排放的來源與流向,我們運用桑基圖(Sankey Diagram)來清晰闡述總排放量究竟來自何處。 分析可從排放範圍著手,並細化至各種類型的資源消耗所產生的具體排放情況。
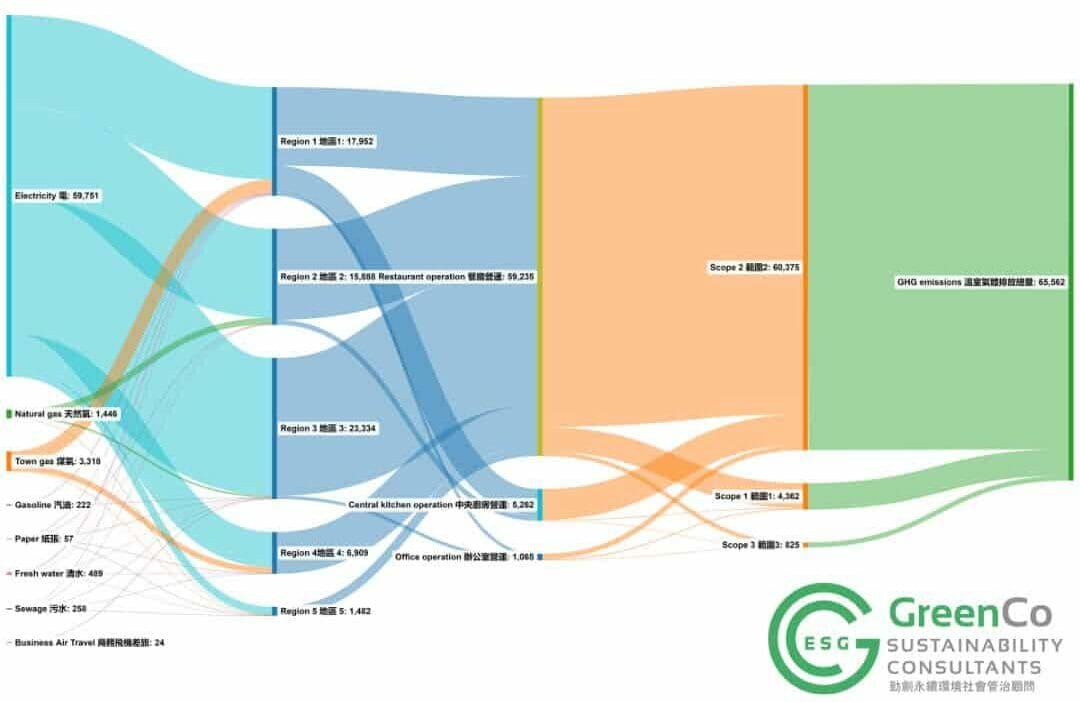
The Sankey Diagram helps us show the most important contributions to the flow. As a visualization tool, it also helps the easy understanding of our clients and report readers.
關於 GreenCo ESG 顧問

免責聲明免責聲明: 本ESG分析不能用作涵蓋特定情況且不建議在未獲得專業建議的情況下使用其中的信息。勤創永續及其董事、員工和代理人對由於任何人依賴本分析中的信息而採取或不採取的任何行動所造成的任何損失不承擔任何責任或義務。
Disclaimer: The ESG news and analysis cannot be relied upon to cover specific situations and the information in the news and analysis is not suggested to be used without obtaining specific professional advice. Greenco and its directors, employees and agents do not accept or assume any liability or duty of care for any loss arising from any action taken or not taken by anyone in reliance upon the information in this news and analysis or for any decision based on it.